Cohort analysis: Understanding the basics and getting started

Cohort analysis can help you know about the long-term health of your business. For a business to be successful, it’s important that you not only acquire new customers but retain the existing ones. The best way you can make customers stick with your brand is by providing them with personalized experiences.
You can utilize large amounts of data generated from the marketing and sales team of your company. You can implement business analytics to derive valuable insights from this data and create exceptional customer experience. Cohort analysis is one such practice that can help you understand data and build targeted experiences for customers.
In this blog, we will give you in-depth information about customer cohort analysis, customer cohort tracking, and retention cohort analysis.
What is cohort analysis?
Cohort analysis definition: It is a type of behavioral analytics in which large amounts of data are broken down into groups to perform analysis. These smaller groups are called cohorts. Cohorts are created on the basis of common characteristics, traits, or experiences shared by a group of people within a specific time period.
By creating a cohort chart, businesses can recognize any patterns or trends that exist during the lifecycle of a customer through a cohort. Analyzing each individual customer is a strenuous and time-consuming task. The user cohort analysis helps you analyze a large number of customers’ data at the same time.
From customer cohorts analysis, marketers can find out valuable information about specific cohorts. They can create strategies and tactics to target specific customer cohorts to improve their experience and retention rate. However, keep in mind that cohort study is different than cohort analysis.
In a cohort study, the data is broken down into small and similar groups whereas in a cohort analysis, the analysis is performed on the basis of big data and business analytics. Cohort analytics is also used to measure user engagement over a specific period of time.
For the user engagement cohort report, the data is taken from the eCommerce platform or web app. Instead of looking at all the users together, cohort analysis helps you break down data into related customer groups.
Marketing cohort analysis
Cohort analysis provides you with in-depth and actionable information rather than just being a metric to track progress. You can find out insights about different customer demographics. This information can help you to cater them with content and offers that resonate with them.
Cohort analysis example
Cohort analysis meaning is that it is a technique that can help you derive actionable insights from customer data. For instance, your social media platform data can be large and undifferentiated data of all the users. Cohort analysis can help you differentiate your users based on time, engagement, and other events.
For example, customers who use the platform on a daily basis can be put in one cohort. The users who are active only once or less frequently during the month can be put into another cohort. People who have taken subscriptions for ad-free services can be put into a user cohort.
By grouping people in different cohorts, you can understand your customers better. You can know how to target distinct cohorts with the right marketing strategies. By learning about your customers’ behavior, you can create relevant content and offers. A cohort chart can help analysts visualize different groups’ data and track behaviors.
Types of cohort analysis
In this section, we will give you detailed information about the two types of cohort analysis:
- Acquisition Cohorts
- Behavioral Cohorts
1. Acquisition cohorts
Acquisition cohort is a type of cohort analysis that segments users on the basis of when they signed up for your product. This tracking can be performed on the basis of frequency relevant to your product like daily, weekly, monthly, etc. The shared characteristics of this group of users can help analysts measure retention and churn rate within a specific time period.
Acquisition cohort analysis example: A shopping application can do an acquisition cohort analysis on a monthly basis while a food application can do an acquisition cohort analysis on a daily basis.
2. Behavioral cohorts
Behavioral cohort is a type of cohort analysis in which the customers are segmented on the basis of actions they take. You can track special events and understand the customers’ behavior across different demographics.
Behavioral cohort analysis example: A ride-booking cab can track the number of times a customer books a cab and the locations from which they frequently book a cab. A food delivery app can track how frequently a user orders food and from which restaurants they order food the most.
Importance of cohort analysis
Most of the organizations use cohort data analysis to track and improve customer retention rates. Cohort analysis can help you understand your users by tracking their behavioral patterns alongside demographics. It also helps businesses reduce churn rates by helping them offer customers what they need, want, and expect. There are many other applications of cohort analysis for improving the business.
For example: A food delivery app can use cohort analysis to find what customers like and prefer. Based on this information they can offer recommendations and special offers to customers on their preferred timing to get orders. An online apparel store can use cohort analysis to find out what styles customers like and buy the most. This information can help them guide their inventory for creating fashion clothing that gets maximum sales.
How to do cohort analysis?
Cohort analysis might seem intimidating at first with so many data values and distinct colors. Here, we will tell you how you can create and do cohort analysis. We have created a cohort chart for weekly revenue per user. Supposedly, we are looking at the data from the month of May.
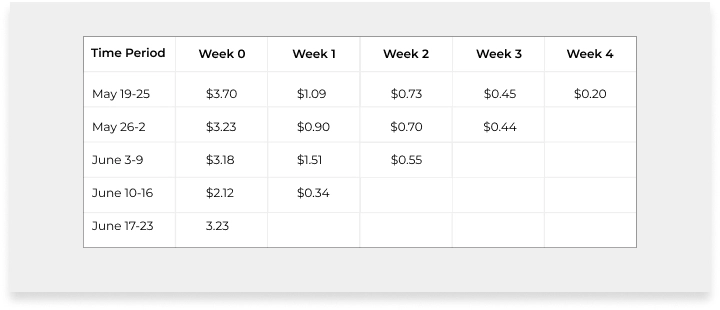
The cohorts are created on the vertical axis from the oldest cohorts to the newest ones. Here, we have created weekly cohorts with June 17 being the latest one. Along the horizontal axis, we have kept the time periods. These are weeks from week 0 to week 4.
Week 0 is the week of acquisition and week 4 is four weeks from the week of acquisition. The cells in the middle have the values for the metric, the weekly revenue per user. From this cohort chart, you can see that users spent $3.70 in the week of acquisition. The following week, the same users on average spent $1.09, the next week they spent $0.73, and so on.
The oldest cohorts have more data since these are the users who have stayed with you for the longest time. Users who were acquired on May 19 had 4 weeks since they were acquired. But the users acquired from June 17 haven’t had full weeks and since the data is less. This sort of data creates triangle-shaped cohort charts, often called as triangle charts.
For better visualization of data trends, you can use color coding. Here, we have used the green color for shading. The darker the color the higher the revenue, the lighter the color the lower the revenue.
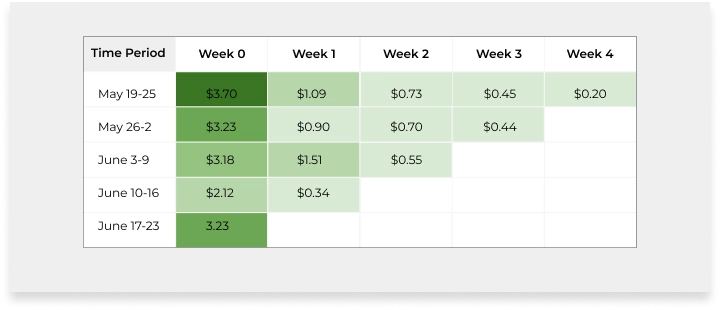
The shading makes it easy to see identify the patterns within cohorts. As here you can see that users spend more during the first weeks and later the value decreases. However, the steep drop from 0 to week 1 is quite common. Most of the time users are active during the first week when they’re acquired and later they become less active.
When you are looking at cohorts, make sure you’re choosing the right cohort size. If you have a few users every week, then the metrics will vary highly. You can also create biweekly or monthly cohorts in that case.
Benefits of cohort analysis
Define cohort analysis: It can help marketers to get valuable insights about their customers and make the right improvements. Below, we have discussed the benefits of conducting cohort analysis.
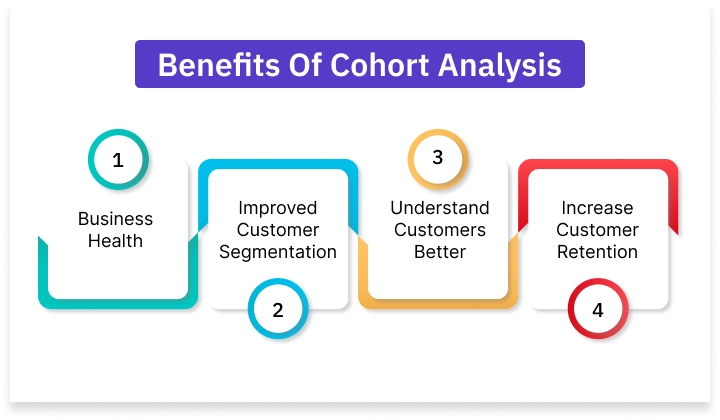
- Business health: The primary focus of any business is generating revenue. A business’s revenue is a great indicator of its success. If a business has increasing revenue even if it’s not acquiring new customers, it means it’s going fine. Cohort analysis can help you find which groups of customers are contributing the highest to revenue. This insight can help you focus your marketing resources and time in the right places.
- Improved customer segmentation: By grouping your customers into cohorts based on their attributes and behaviors can help you target them effectively with marketing campaigns. You can create personalized experiences for your target audience.
- Understand customers better: Cohort analysis can help you understand your customers better by tracking their behavior over a specific period of time. You can identify patterns and trends that can aid you in improving your strategy.
- Increase customer retention: Cohort analysis helps in analyzing customer retention and finding out the potential areas of churn. You can see where the maximum number of customers are leaving your business and how you can take steps to fix it. You can determine ways to optimize your customer journey.
How to calculate customer retention?
As you know, cohort analysis can help to increase customer retention. The customer retention rate is the metric used to analyze the number of customers who stay with a business. You can calculate the customer retention rate by the following formula:
Customer Retention Rate (CRR)= ((E-N)/S) X 100
Here,
- E = Number of customers at the end of the time period
- N= Number of customers acquired during that period
- S= Number of customers at the start of the period
A good customer retention rate is an indicator of higher customer loyalty. It means customers are happy with your offerings. However, remember that to maintain customer loyalty you must reward customers for staying with you.
Webmaxy eGrowth can help you create and run a customer loyalty program. You can reward your customers on their birthdays, repeat purchases, and so on. You can give people a robust reason for sticking with your brand.
Steps to conducting a cohort analysis
In this section, we will discuss how to conduct a cohort analysis. You can use cohort table insights to make significant changes and improve results.
1. Find out where your customers churn
Most often the customers leave a business without giving any reason. You may never know what actually happened and why a customer left. By conducting cohort analysis, you can find the timeline during which customers leave. This way you can determine what was happening around that time.
Acquisition cohort analysis can help you analyze the customers’ lifecycle. You can know when exactly the customers are leaving your business. You can analyze when most of the customers are exiting.
To create an acquisition cohort chart, keep the number of users as various cohorts and each day of the time period as a column. We have given below an acquisition cohort analysis for your reference.
Factors to remember while creating an acquisition cohort analysis:
- Time period: When making a cohort chart for your business or app, use time periods that make sense. For example, if you have a gaming app then you can use a time period of 30 days. If you have a subscription-based app, you can choose a three or six-month time period.
- Focused scope: The more you keep your cohort charts broad, the lesser details you will get. To find out the details of what’s going wrong, you need to carry in-depth cohort analysis. You can break your cohort retention analysis into multiple periods for better understanding.
2. Find features that appeal the most to users
With an acquisition cohort analysis, you can find out when and who is leaving your business. Now, the next step is to determine the possible reasons why these customers left. Have a look at the drop-off days and consider adding promotions or offers on these days. Try to find out which features of your app make customers stick with your business for long.
Once you know the core features of your app, you can use them to your advantage. You can also use Webmaxy Analyzer to conduct surveys and get answers from your customers directly. Work on problem areas that might cause customer churn. Focus on optimizing the customer journey and improving the overall customer experience.
3. Compare behavioral cohorts
Well, it’s not just features that cause customer cohort churn. It’s both features and behaviors that affect customer churn. For example, customers who complete the onboarding process with details are less likely to leave than those who didn’t complete the set-up. This is a behavioral aspect from which you can predict the likelihood of a customer staying with you.
Behavioral cohort analysis can help you find out the behaviors that lead to certain outcomes. From the above example, you can predict which customers are about to leave. This way you can send them promotions or offers priorly before these customers churn. In-depth data analysis can help you understand the relation between customers’ behavior and retention.
Cohort analysis: The conclusion
Cohort analysis is the method used to analyze customer data and get a comprehensive view of customer churn. You can find out when and where the maximum customers churn during their lifetime. Cohort analysis can help you do marketing funnel analysis.
Having a cohort chart can help you find out the possible reasons for customer churn. Once you know the reasons, you can work to make improvements. You can also plan to target cohorts with different marketing strategies based on their traits and behavioral patterns.
Webmaxy eGrowth is an eCommerce management platform that can help you carry out marketing effectively. It comes with a customer segmentation feature that enables you to segment your audience on the basis of their attributes and behaviors. Then, you can create and launch personalized marketing campaigns.
Additionally, eGrowth comes with many features like a KPI dashboard, marketing insights, marketing workflow, social campaigns, email marketing, Whatsapp marketing, customer loyalty, Omnichannel support, and retargeting. Schedule a call with our experts to learn more about Webmaxy eGrowth or email us at info@webmaxy.co.
Want to segment customers based on their behavior?
Start your Webmaxy eGrowth journey today!
Cohort analysis: FAQs
A cohort is a group of customers that share common attributes or characteristics. Cohorts are created to analyze customer data effectively and efficiently. It helps to identify the patterns and trends that exist in the customer data. Cohort data are the data values that exist in the cohort chart.
Cohort analysis is the process in which customer data is segmented into smaller groups to understand it effectively. Cohort analysis helps to identify patterns or trends that exist within the customer data over a period of time. It helps marketers to understand when customers churn and what might be the possible reasons for it.
Cohort analysis can be used by any business that wants to analyze customer retention and churn over a period of time. An example of a cohort analysis can be a gaming platform. They can use acquisition cohort analysis to see the customer acquisition and drop-off rate over a period of a month.
Cohort analysis can help marketers and business owners in many different ways. We have given below some crucial reasons why you should do cohort analysis.
– To analyze business health.
– Effective customer segmentation.
– Understand customers better.
– Increased customer retention.
Cohort analysis helps to understand the behaviors of a segment of users from your entire user population. You can know how to improve your marketing efforts to help prevent the users from churning. It can help you draw predictions about when customers tend to leave the most so you can create strategies to offer something that makes them stay.
Cohort analysis can help you understand your customers better and make improvements. The two types of cohort analysis are as follows:
– Acquisition cohort analysis
– Behavioral cohort analysis
Adam Wilson
Adam Wilson comes with an experience of 12+ years in the IT industry. As a Customer Success Manager, he has been researching and trying to understand the customers’ behavior in different scenarios. He has also studied human psychology to relate it to the purchase journey of the customers. His published books on customer psychology and behavior have received many honors and awards from various enterprises.


